primary research

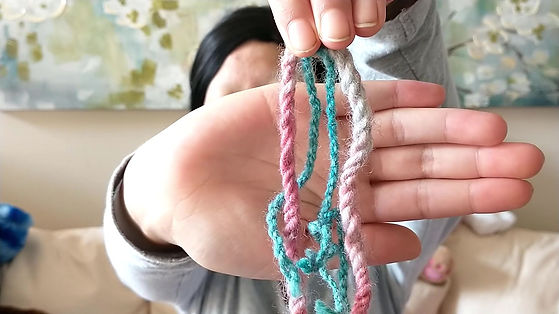
All of the above videos document some aspect of the primary research process. This includes figuring out how to spin the samples, an explanation of ply structures, an experiment vlog, a project diaries video, and the final project feature video.
PURPOSE
I love creating beautiful things. That's probably the only reason I am a textile artist. (Read: someone who spends painstaking hours crocheting lace.) Being that I do ridiculous things like... spend half a year knitting a scarf that laypeople will not even bat an eye at, it's important to me that the things I make last.
As a result, I decided to do my project on tensile strength in yarn, and how ply structure can make things stronger (or weaker).

introduction

Tensile strength henceforth refers to ultimate tensile strength. This is a measure of the maximum force that can be applied before breaking, compared to the cross-sectional area of the material. Mathematically, this relationship can be defined as F_TU=F/A, which means that it is measured in N/m^2, which is equal to the SI unit of Pascals (Pa).
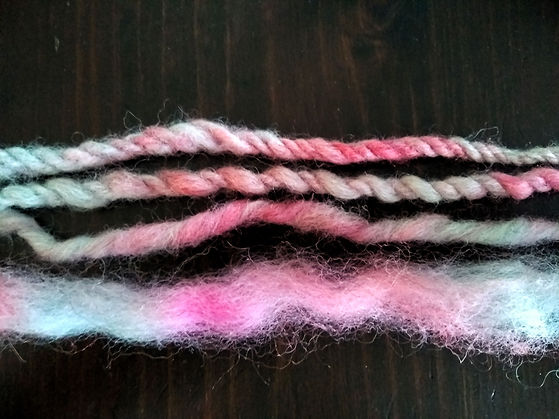
A review of the literature found that adding plies to yarn increases properties such as strength, elongation, evenness, hairiness, abrasion resistance, bulkiness, and twist liveliness. This can be proven in experiments by spinning yarns of various numbers of plies and then measuring the amount of weight they can support.
HYPOTHESIS
Based on both the literature and my c. decade of experience in knitting, I hypothesized that if the number of plies increases, then the amount of weight that can be supported will likewise increase.
This is backed up by the literature, although there is little theoretical work on how yarns with greater than 2 plies behave. I suspected that the tensile strength would increase greatly from single-ply to 2-ply, but that it would increase less in the 3-ply and 4-ply.
PURPOSE
I love creating beautiful things. That's probably the only reason I am a textile artist. (Read: someone who spends painstaking hours crocheting lace.) Being that I do ridiculous things like... spend half a year knitting a scarf that laypeople will not even bat an eye at, it's important to me that the things I make last.
As a result, I decided to do my project on tensile strength in yarn, and how ply structure can make things stronger (or weaker).

MATERIALS
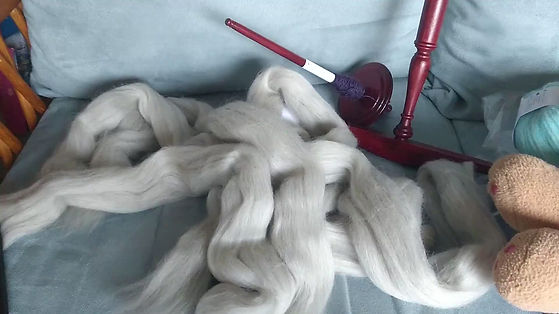
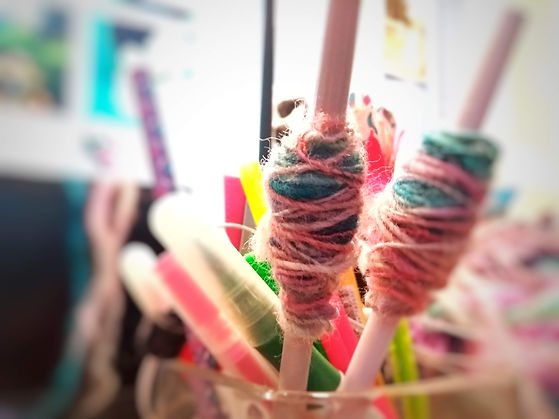
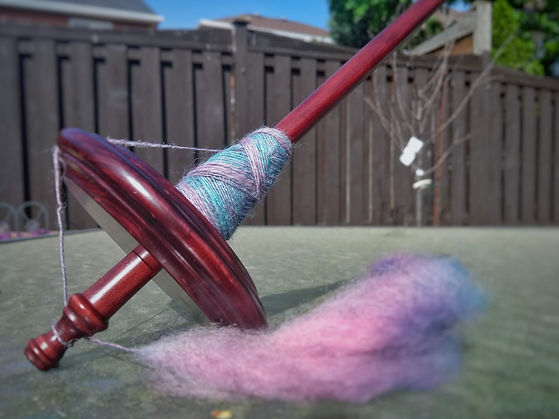
The yarn used in my experiment was all handspun from 100% Peruvian wool. Before spinning, it was hand-dyed in order to create differentiation between trials and make it easier to manage the experiment. In order to spin the yarn, I used a 3.5 oz. top-whorl drop spindle.
To measure the amount of stress it could withstand, I used water and a bucket. The bucket weighed 2.2 lbs (0.99 kg) and had its handle wrapped in a piece of quilting cotton.
VARIABLES
The dependent variable in this experiment is the amount of water that could be supported by the yarn. This can be used to calculate tensile strength.
The independent variable in this experiment is the number of plies.
The controlled variable is material composition. While yarn is inherently a heterogeneous material, all the samples were spun from the same braid of wool. We also tried to hold the cross-sectional area, length, and angle of twist constant.
SPINNING METHOD
The braid of combed top was divided into 6 parts crosswise. Then, it was stripped lengthwise 16 times. Each of the resultant pieces represents the quantity of fiber used for a yarn sample.
The fiber for 2-ply yarns was stripped lengthwise into 2 pieces; for 3-ply, it was stripped into 3 pieces; for 4-ply, it was stripped into 4 pieces. Then, it was spun on a drop spindle to a 76-degree angle of twist and plied (if applicable) in the opposite direction of single twist; they are then trimmed to 48 cm in length.
STRESS TEST METHOD
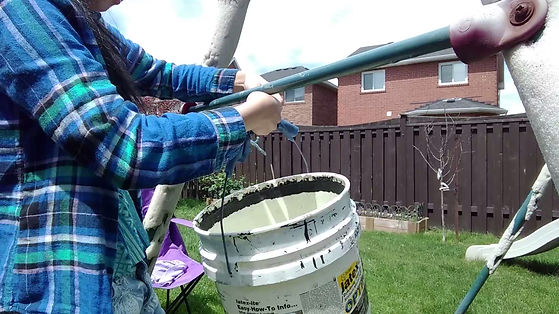
To measure the tensile strength, the yarn is doubled and a bucket is hung on the fold. This is secured with an overhead knot.
Water is added to the bucket in increments of 5 dL. Once the yarn snaps and the bucket drops, the number of increments is recorded.
RAW DATA TABLE
This table shows the increments of water that could be supported as the dependent variable and the number of plies as the independent variable. The columns are coloured based on the colour of their respective yarn sample for ease of communication.

data processing

Based on the disparity between the data sets, I decided to calculate each of the cross-sectional areas of the yarn samples individually. This was done by measuring the number of wraps of yarn that fit in 3 cm. This number is converted to the diameter of the yarn by taking (3 cm) / (wraps / 3 cm). Dividing by 2 yields the radius, which is then used to calculate the approximate cross-sectional area using 2πr^2. I used the average of the values for each number of plies in my processed table.
The tensile force was calculated by determining the sum of the weight of the water and the weight of the bucket. The weight of the water is calculated by multiplying increments by 5 to yield the number of deciliters, which is then converted to mass in kilograms. This is added to the weight of the bucket (1.99 kg) which was taken as the difference between my weight and the weight of myself plus the bucket (97 - 99.2 = 2.2 lbs).
PROCESSED DATA TABLE
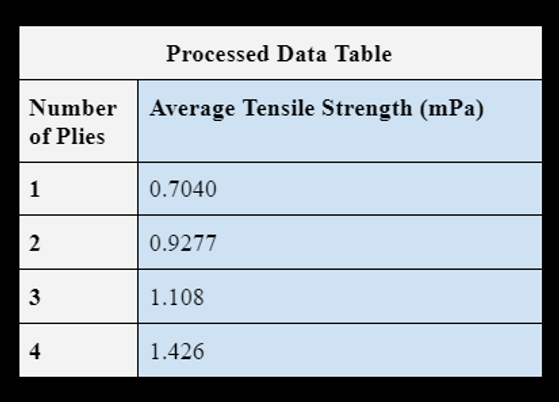
The processed data table shows the average tensile strength in megapascals as the dependent variable and the number of plies as the independent variable.
GRAPH
Graphing this data, we get a fairly strong linear trend with slope 0.235 and R^2 = 0.986. The exact value of the slope should not be taken too seriously as there is little theoretical data available to compare against, and 5 trials is not enough to determine the relevant coefficients that would be used in an equation.
(Also, I was sick during trials, and I tend towards brain fogginess when sick. This means that there is some margin of error.)

CONCLUSION
This exploration verifies the hypothesis that the number of plies is directly proportional to tensile strength. While the literature suggested that this would not be a linear trend, the experimental result, in this case, was that the line of best fit was still linear.
The 3-ply yarn is noted as a deviation from the slope, as it is below the line of best fit. In many cases with the raw data, the 3-ply yarn appeared to be an outlier; however, given the small number of trials performed, none of the data was removed.
ERROR ANALYSIS
There is much potential for calculated error. For example, the cross-sectional area of the yarn is not calculated exactly, since yarns do not have perfectly circular cross-sections. Furthermore, given that the samples were handspun, there is potential for inconsistencies, which would result in localized strain and thus an underestimation of the actual tensile strength (i.e. earlier necking). Other factors include varying degree of felting, the timing of water addition, lack of fibre homogeneity, inconsistent yarn count (linear density), and strength of the knot (knots add pressure which decreases tensile strength).
